Analytics & Reporting
Report your media library effectiveness
and control the team workflow with Pics.io Analytics & Reporting feature
How can you benefit from Pics.io’s analytics & reporting feature?
Unlock the relevant statistics for your media library effectiveness and generate visual reports to show the performance of your team and control their work.
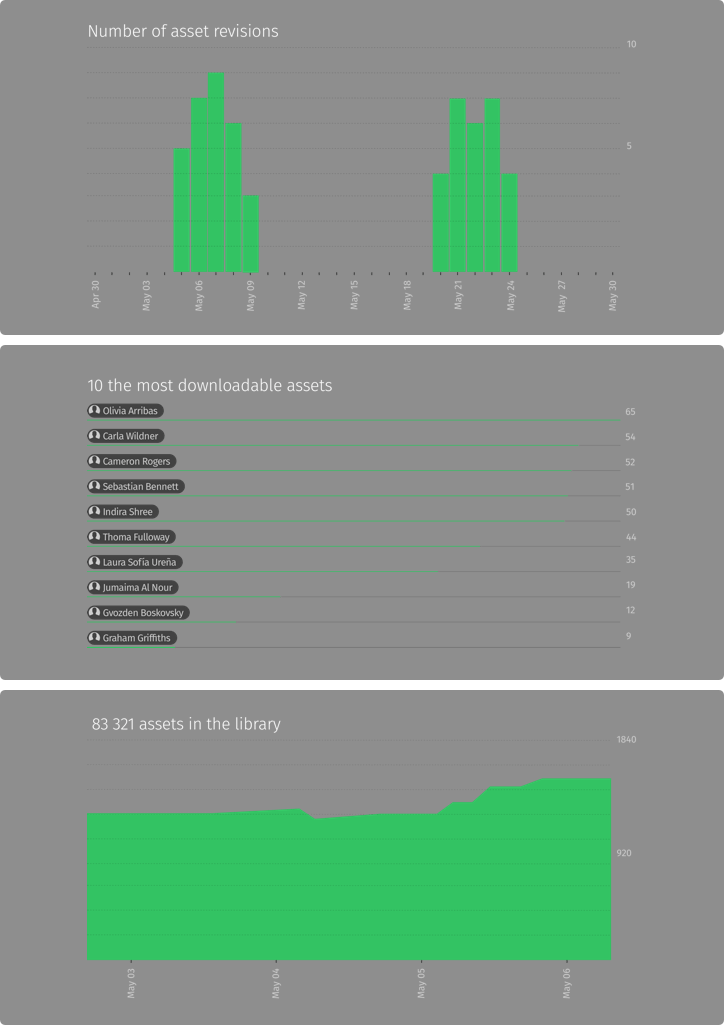
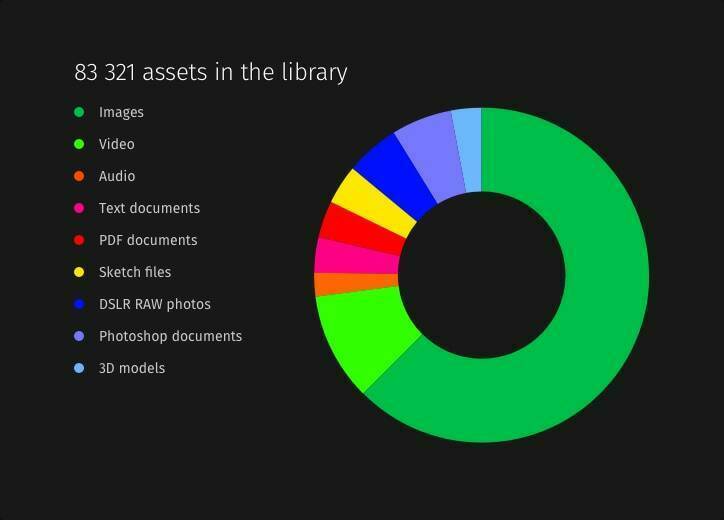
- General statistics on a digital library - understand the content filling of your digital library and how the storage space is spread between different asset formats. Control the number of active websites and gain basic statistics on assets usage within the system.
- Detailed reports on assets usage - run detailed reports on how users are engaging with photos, videos, documents, and other digital assets stored in Pics.io. Compare how different asset types perform and find relevant insights.
- Detailed analytics for the shared assets - control the performance in your collections published outside and get comprehensive details like how many assets are downloaded and shared on the specific websites.
- Audit of the team performance - keep track of the Pics.io service usage over time and see reports on who has downloaded which file and when. See the top shares, comments, keywords, metadata, and more.
Provide the relevant data for different user groups
Different teams within the organization rely on different data. Analytics functionality can provide required reports for each specific groups:
- Management - gets insights on DAM system effectiveness
- Team owners - understand the workflow on assets within the team, monitor the activities of the teammates, and improve the potential bottlenecks in the workflow.
- Teammates - the new teammates can more easily understand the structure of the digital library, get valuable insights on its performance, and quickly integrate into the team workflow.
Trusted by various businesses around the world

Pics.io has dramatically sped-up the process of storing, sorting, and searching our photos. The positive impact it has had on our productivity has been immeasurable. And it uses our existing Google Drive storage, so no need to manage yet another cloud storage platform.
Embrace your digital content
Free 7-day trial
No credit card required
Set up in 3 minutes or less